
For decades, the Brew Control Chart and its closely related “Golden Cup” standard have been cornerstones in the coffee industry.
With a history spanning over 60 years, these guidelines have steered us toward brewing that elusive “perfect” cup of coffee. Yet, recent scientific scrutiny has raised questions about their long-standing validity.
So, what exactly are the issues with the Golden Cup and the Brew Control Chart? And what alternatives might science offer in their place? Let’s dive deeper to gain a clearer understanding.
TL;DR
- The Brewing control chart needs to be revisited. We don’t know much about the 1957 research that led to the chart’s creation.
- It appears slightly arbitrary that we have this specific “ideal” zone. European surveys show a preference for higher TDS, and older research predating the brewing control chart suggested extractions down to 17.5% were palatable.
- The suggested optimum zone results in a nonsensical coffee-to-water ratio range of 1:16.6-1:20.
- New research from UC Davis indicates that two clusters of coffee consumers prefer different locations on the brewing control chart.
- My takeaway: Coffee should always be guided by your tastebuds – never by science. Modern food science doesn’t believe in a “one-size-fits-all” approach.
What is the Golden Cup Standard?
For the average coffee drinker, the notion of a “Golden Cup” probably suggests a particular ratio of coffee to water. If you search online, it’s often defined as using 55 to 60 grams of coffee per liter of water.
However, in the coffee industry, the definition is more nuanced.
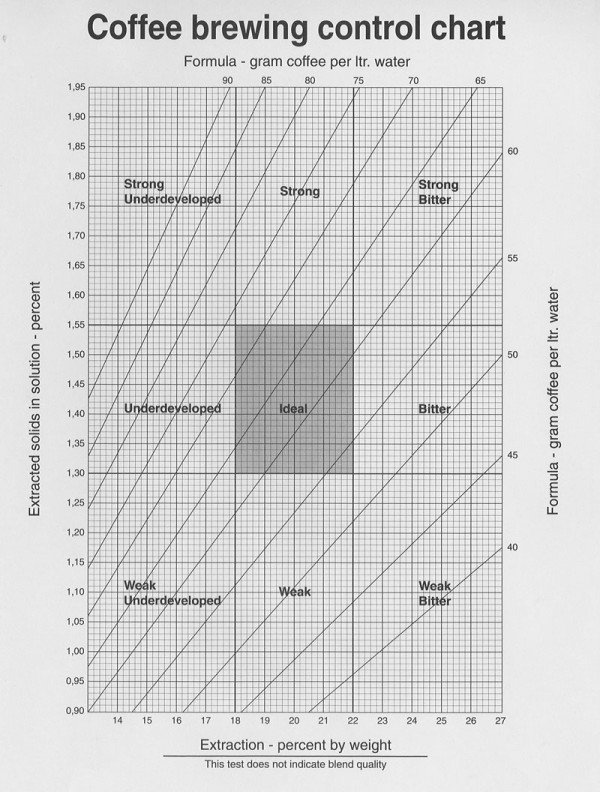
The industry uses a tool called the Brew Control Chart to define the Golden Cup standard. This chart has two axes: one for strength (usually called TDS) and another for extraction percentage/yield, indicating how much coffee you’ve extracted from the beans into the brew.
The Golden Cup standard dictates that coffee should fall right in the middle of this chart, with a strength between 1.15-1.35 TDS (Total Dissolved Solids) and an extraction percentage between 18-22%.
Taking a closer look at the Specialty Coffee Association’s traditional definition, you’ll find a rather specific guideline for the golden ratio of coffee brewing:
55 grams of coffee per liter of water, with a margin of plus or minus 10 percent being acceptable.
This means, theoretically, you could use between 49.5 and 60.5 grams of coffee for every liter of water you brew with.
💡 Sidenote: When examining older coffee brewing charts, they typically recommend a brewing ratio between 1:14.5 and 1:16.5.
In recent versions, this recommendation has shifted. While I haven’t found a concrete source to explain when and how the changes were made, it’s believed there were errors in Professor Lockhart’s original calculations.
Interestingly, the original ratio closely matches the preferences of many home-brewers today. If you know anything about this mystery, send me a DM!
Historical Context
The Brew Control Chart and its brewing recommendations are often attributed to Professor Earnest Lockhart, who conducted extensive research on coffee in the 1950s.
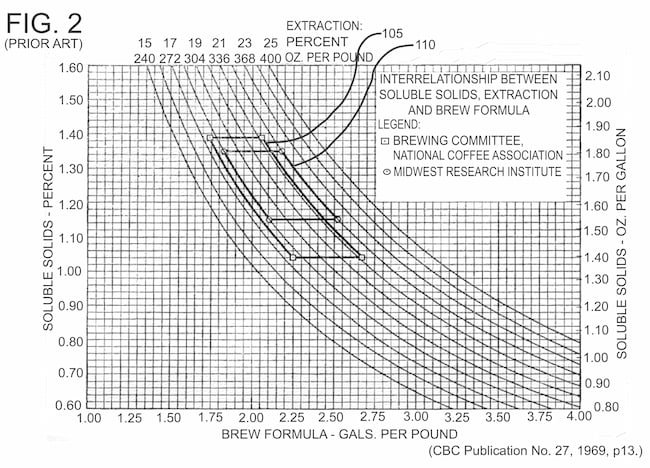
However, according to David Walsh, R&D Manager at Marco Beverage Systems, the initial research that gave us the 18-22% extraction guideline was created in 1957 by the Midwest Research Institute.
David Walsh dived deep into the topic of the Brew Control Chart back in 2012 with a series of blog posts, experiments and a presentation at the Nordic Barista Cup on the topic that is still well worth watching today.
Besides, the most recent research from UC Davis, this is the most comprehensive deep dive I have encountered.
David Walsh pointed out in his presentation that America and Europe had divergent practices regarding coffee-to-water ratios at the start of the 1900s. In the U.S., it wasn’t uncommon to see a scant 14-gram-per-liter ratio for coffee brewing, considered weak by French standards, where ratios as high as 120 grams per liter were reported.
By the early 1950s, the landscape changed again. The National Coffee Association (NCA), representing Coffee Roasters, and the Pan American Coffee Bureau, representing coffee growers, teamed up to form the Coffee Brewing Institute (CBI). Walsh notes that they “started funding and publishing lots and lots of research,” which eventually led to the Brew Control Chart we know today.
One of the most fascinating—and perplexing—details to come out of this research was a study conducted before 1957 by the brewing committee of the NCA. This study defined the “region of optimal taste” for coffee brewing to be between 17.5 percent and 21.2 percent extraction.
Just a few years later, the Midwest Research Institute altered this range to between 18 and 22 percent extraction. This extraction range has been widely accepted and propagated by various coffee associations ever since.
It’s worth pointing out that both Norwegian and European-focused surveys have unveiled a preference for higher strength than the results from the US.
The ideal maximum strength, according to the classic Brew Control Chart is 1.35 TDS, but Europeans seem to like up to 1.45-1.50 TDS.
(As a European myself, I can confirm. I do enjoy coffee with a higher TDS 🤷)
If we were to take this into account, it would change where you draw the center square on the chart, and thus, also change the suggested dose for the “Golden Cup”
Murky RESEARCH
Returning to David Walsh and his investigation into the Brew Control Chart, his inquisitiveness led him to delve deep into the origins of its percentages. He scoured historical publications and academic papers, only to arrive at a puzzling conclusion: the exact methodologies behind the research remain elusive.
He found references to the 18 to 22 percent range, but no comprehensive details that provided insight into how these figures were obtained.
Walsh pointed out that the lack of transparency about the methodology leaves many unanswered questions:
“Was 18 percent just as preferable as 22 percent? Does it drop off sharply at the edges? Is there a peak somewhere in the middle?”
According to him, while the 18-22 percent extraction range results have stood for over 60 years, “we don’t really own this information. They’ve given us the answer, but we don’t have the knowledge or understanding of how they did this,” he remarked in his presentation more than a decade ago.
So, while the Brew Control Chart and the “Golden Cup” standard have been mainstays in the coffee industry for decades, the origins of one of their key components remain surprisingly nebulous.
My opinion 🤨
Let’s be upfront—I’ve always found SCA’s heritage coffee-to-water ratios bizarre.
Sure, you can brew a cup with 55 grams of coffee per liter if you’ve got a top-notch grinder and high-quality coffee beans. But if you don’t know what you’re doing, you’ll often end up with a thin or bitter cup.
The Specialty Coffee Association’s recommendation essentially falls between a 1:16.6 and a 1:20 ratio. Mathematically speaking, you can only achieve the suggested Total Dissolved Solids (TDS) and extraction percentage within these ratios.
However, if you know just a little bit about coffee, you also know that it’s exceedingly rare to see that people are brewing at ratios such as 1:19-1:20.
More commonly, you’ll find ratios ranging from 1:15 to 1:17, making 1:18 quite an outlier.
Therefore, if most people are brewing their coffee at home or in cafes differently, there’s probably something wrong with the theory.
Modern Science Weighs In
The debate around the Brew Control Chart and the Golden Cup seems to have been dormant for almost a decade, before it was reignited again in 2020, when researchers from UC Davis published a paper titled:
“Consumer preferences for black coffee are spread over a wide range of brew strengths and extraction yields”
Its academic-sounding title boils down to a simple point: People actually like a wider variety of coffee strengths and extractions than what the original brew control chart suggests.
The study involved 118 coffee drinkers, primarily college students, who all drink black coffee. They sampled coffee varying in Total Dissolved Solids (TDS), Percentage Extraction Yield (PE), and Brew Temperature (BT), rating their experience on multiple factors like flavor and temperature. Advanced statistical methods like cluster analysis were used to analyze the data. The main finding was that people’s coffee preferences can be grouped into two main categories, especially concerning TDS, and that these groups enjoy coffees that would fall out of the “Ideal” zone in the old Coffee Brew Chart.
Besides that, the researchers also have several points of criticism regarding the old chart.
First, the chart combines neutral terms with value judgments. Simply, it tells you, “This is the best way to make coffee.” However, modern food science suggests that there’s no one “best” way that applies to everyone.
Second, the chart proposes a specific “ideal” range for brewing.
But it doesn’t explain what happens if you go outside that range. For example, if you make a strong cup of coffee that falls below 18% extraction, the chart labels it as “strong underdeveloped.” But what does this mean flavor-wise?
Additionally, the chart isn’t clear about the range between 18% to 22% extraction. Is it better to be precisely in the middle, or are there some good experiences to be had at the extremes?
The chart doesn’t provide this information, even though anyone who’s used a coffee refractometer can tell you there’s a noticeable difference between 18% and 22%.
The new brew control chart
In a new study from 2023, the same UC Davis scientists who questioned the traditional Coffee Brewing Control Chart have come back with more research. They’ve even proposed a new Brew Control Chart. What’s different this time?
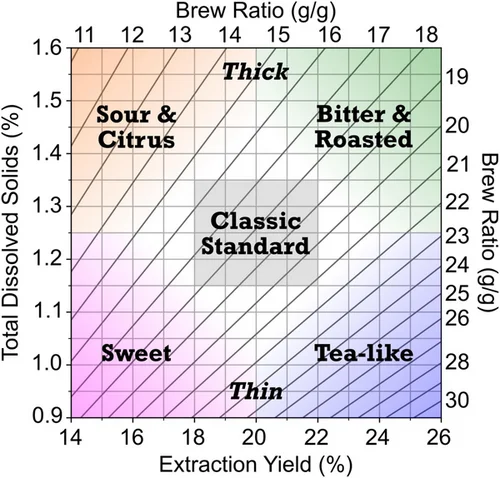
The researchers are addressing two main points:
- Taste Descriptors: The new chart aims to describe what the coffee tastes like at different strengths and extraction levels, rather than just labeling it as “underdeveloped” or “bitter.”
- No judgement: There is still a zone in the middle of the chart that indicates the classic standard, but the areas surrounding it are not described as problematic.
- Consumer Preferences: The study found that people generally fall into one of two groups regarding coffee preferences. So, rather than finding a one-size-fits-all solution, the study suggests tailoring the brew to satisfy these two separate groups is better. The researchers also plot these cluster preferences onto a brew control chart.
Cluster 1 prefers coffee that isn’t too bitter or sour; they enjoy a low Total Dissolved Solids (TDS) and a medium extraction percentage. Interestingly, the researchers find that a really low TDS matches with sweetness.
I haven’t given this much thought before, but it aligns with some of my experiences. There have been times when I was surprised that a nice-tasting coffee would only score 1.05 TDS on my refractometer.
On the other hand, Cluster 2 has a broader range of tastes. The researchers speculate that this group might be made up of more experienced coffee drinkers:
“The second preference segment liked equally coffees with acid/sour, citrus, berry, and dried fruit sensory attributes on the one hand or coffees with roasted, burnt/ash, thick, and black tea sensory attributes on the other hand (…)
(..) This was unexpected and may seem odd, but it occurs to us that those areas of the BCC match the flavor profiles of high-quality specialty coffees and typical espresso blends, respectively, and may speak to a preference segment of more experienced and neophilic coffee drinkers, who were familiar with a broader range of coffees.”
“The neophilic coffee drinker?” Is that you and me? The dictionary defines it as “a person or animal that enjoys new or novel experiences or food.” You have to be a bit neophilic to start experimenting with anaerobic fermentations.
No wonder it can be challenging to fit us all into a chart.
The future of brewing?
So, what does this new chart mean for us coffee drinkers? Well, it shows that areas previously considered “no-go zones” in the old chart are now open for exploration. If you enjoy a high TDS/low extraction coffee that tastes sour or citrusy, the new chart says that’s perfectly okay. It’s liberating, to say the least!
Overall, I find that the new chart echoes my own experiences pretty well. The traditional brew control chart was far too rigid regarding TDS preferences – because of this, brewing at a 1:15 ratio could not be defined as living up to the Gold Cup Standard while brewing at a 1:20 ratio could. This didn’t make any sense, and was only the result of a narrow mathematical emphasis on being able to draw lines that landed within the square.
If you look at coffee competitions, the winning cups were always closer to the 1:15 ratio, and among homebrewers, I’d say that 1:15-1:17 is the de facto gold standard.
Nowadays, most coffee drinkers have experienced espresso with a TDS between 8-12%. So why should a TDS slightly higher than 1.35 not be included in the ideal zone?
In 1957, when the charts were created, espresso hadn’t been introduced to North America. I also doubt there were perfectly processed single-origin coffee available.
Clearly, we need to account for these changes. This also goes the other way – more and more coffee pros advocate for stepping beyond the 22% extraction yield and going much higher. This is possible due to innovations in coffee equipment, such as zero-bypass brewers, new roasting styles, and farming practices.
The coffee industry has been dogmatic, sticking to rigid rules for too long. We’ve trusted that what we believed to be “scientific” was the ultimate truth. The emerging evidence suggests it’s time to revisit some of our long-held beliefs about coffee brewing.
One of my pet peeves is that most coffee shops are stuck in this closed-off mindset. They follow the Golden Cup for drip coffee and the 1:2 shot for espressos (which could almost be considered the Golden Cup equivalent in the espresso version). The result? A weak cup of pour over and an overly strong and acidic espresso shot.
If you’d survey your customers, I’d almost guarantee they’d prefer shots at a 1:3 ratio and drip coffee with a TDS of around 1.40-1.45.
I have said this for many years, and the recent study is a good reminder: Coffee is something you drink to enjoy – your tastebuds should be the ultimate judges, not some ancient chart.
